Writing and Reading Empirical Papers
ECON 480 · Econometrics · Fall 2019
Ryan Safner
Assistant Professor of Economics
safner@hood.edu
ryansafner/metricsf19
metricsF19.classes.ryansafner.com
Finding a Research Question
A paper needs a specific research question that you will ask and provide evidence towards a clear, quantifiable answer
Good research questions are:
A claim about something
- Capital punishment is the most efficient deterrent for violent crimes.
- Women are paid, on average, $0.33 less than men performing the same work.
As specific as possible, given the length constraints
- Do candidates that spend more money than their opponents tend to win Congressional races?
Testable, with data that can provide some evidence one way or another
- One study will never be "the" definitive proof of something, only evidence suggesting one conclusion over others
Structure of an Empirical Paper
Introduction
Literature Review
Theory/Model
Data Description
Empirical Model
Results/Implications
Bibliography
Introduction
Get to your research question ASAP! Make it the first sentence even.
Hook your reader
- Who cares? Why is this important? Why is this relevant? How does this affect people?
- Statistics and background information can often help
- Who cares? Why is this important? Why is this relevant? How does this affect people?
Example: As a student writing an empirical research paper, does writing a longer paper attain a higher grade?
Introduction II
- State your research question clearly and quickly
Introduction II
State your research question clearly and quickly
Do NOT write a "blog post" about how you became interested in the question, or all the work (and dead-ends) that led you to your answer
- Nobody cares about the labor pains, they just want to see the baby!
Introduction II
State your research question clearly and quickly
Do NOT write a "blog post" about how you became interested in the question, or all the work (and dead-ends) that led you to your answer
- Nobody cares about the labor pains, they just want to see the baby!
- Outline:
- Why your question matters
- How do you answer the question in this paper?
- What approach do you use? What data?
- What are your most important results?
Introduction III
Example: I estimate the relationship between paper length and grades by using a simple OLS regression using sample data collected from previous classes. I find that there is a strong positive effect, that students who write longer papers earn higher grades. On average, for every additional page written, grades improve by less than a point. These results are robust to a number of different model specifications and controls.
Introduction IV
Most people do not write enough in their introductions
Consider the incentives of a (skimming) reader pressed for time
- If someone only skims your intro, what do you want them to know??
My rough suggestion: make your introduction about 15-20% of your paper:
| Paper Length | Intro Length |
|---|---|
| 5 pages | 1-1.5 pages |
| 10 pages | 2-2.5 pages |
| 30 pages | 5 pages |
Literature Review
Literature Review can be summarized into the introduction or given its' own section (debatable)
No work is totally original
- What have other relevant researchers written and discovered about your topic?
- What data and models did they use? What did they find?
- How does your paper connect (new data? new model? different angle?) and stand apart from what's been done?
Theory
These are economics papers, so you must describe some economic theory behind the question you are asking and answering
Most scholarly papers have a formal economic model, which then generates predictions that they test for with data
You do not need a model, but you do need to discuss economic principles or concepts that are relevant
- Often there may be multiple theories that might conflict, or our expectations might not be clear (these are the best papers!)
- There may be a significant tradeoff between competing goals, values, or expectations
Theory II
Example: Students that write longer papers likely place higher value on their work and dedicate more resources towards improving its quality, resulting in higher grades.
However, some students hope or believe that longer papers earn higher grades, and will simply put extra low quality filler in their paper to inflate the length. These students likely earn lower grades as a result.
Data I
- Describe your data sources
- Who collected or compiled the data and how?
- e.g. government agencies, businesses, nonprofits, social surveys, etc.
- If you collected your own data, what was your procedure?
- Who collected or compiled the data and how?
Data II
- Describe the data itself
- What are your variables? What--specifically, and in English--does each measure?
- How many observations do you have?
- If you transformed your variables--how and why?
- e.g. recoded into categories or dummies
- e.g. took logs or rescaled units
Data III
Show your data! Show us basic summary statistics and any patterns
- Use your judgment: .onfire[we don't want or need to see everything]
- What do you think is interesting or important?
- Plots > Tables > Words > Nothing
Good ideas to always have:
- A table(s) of variables and their description
- A table(s) of summary statistics of variables
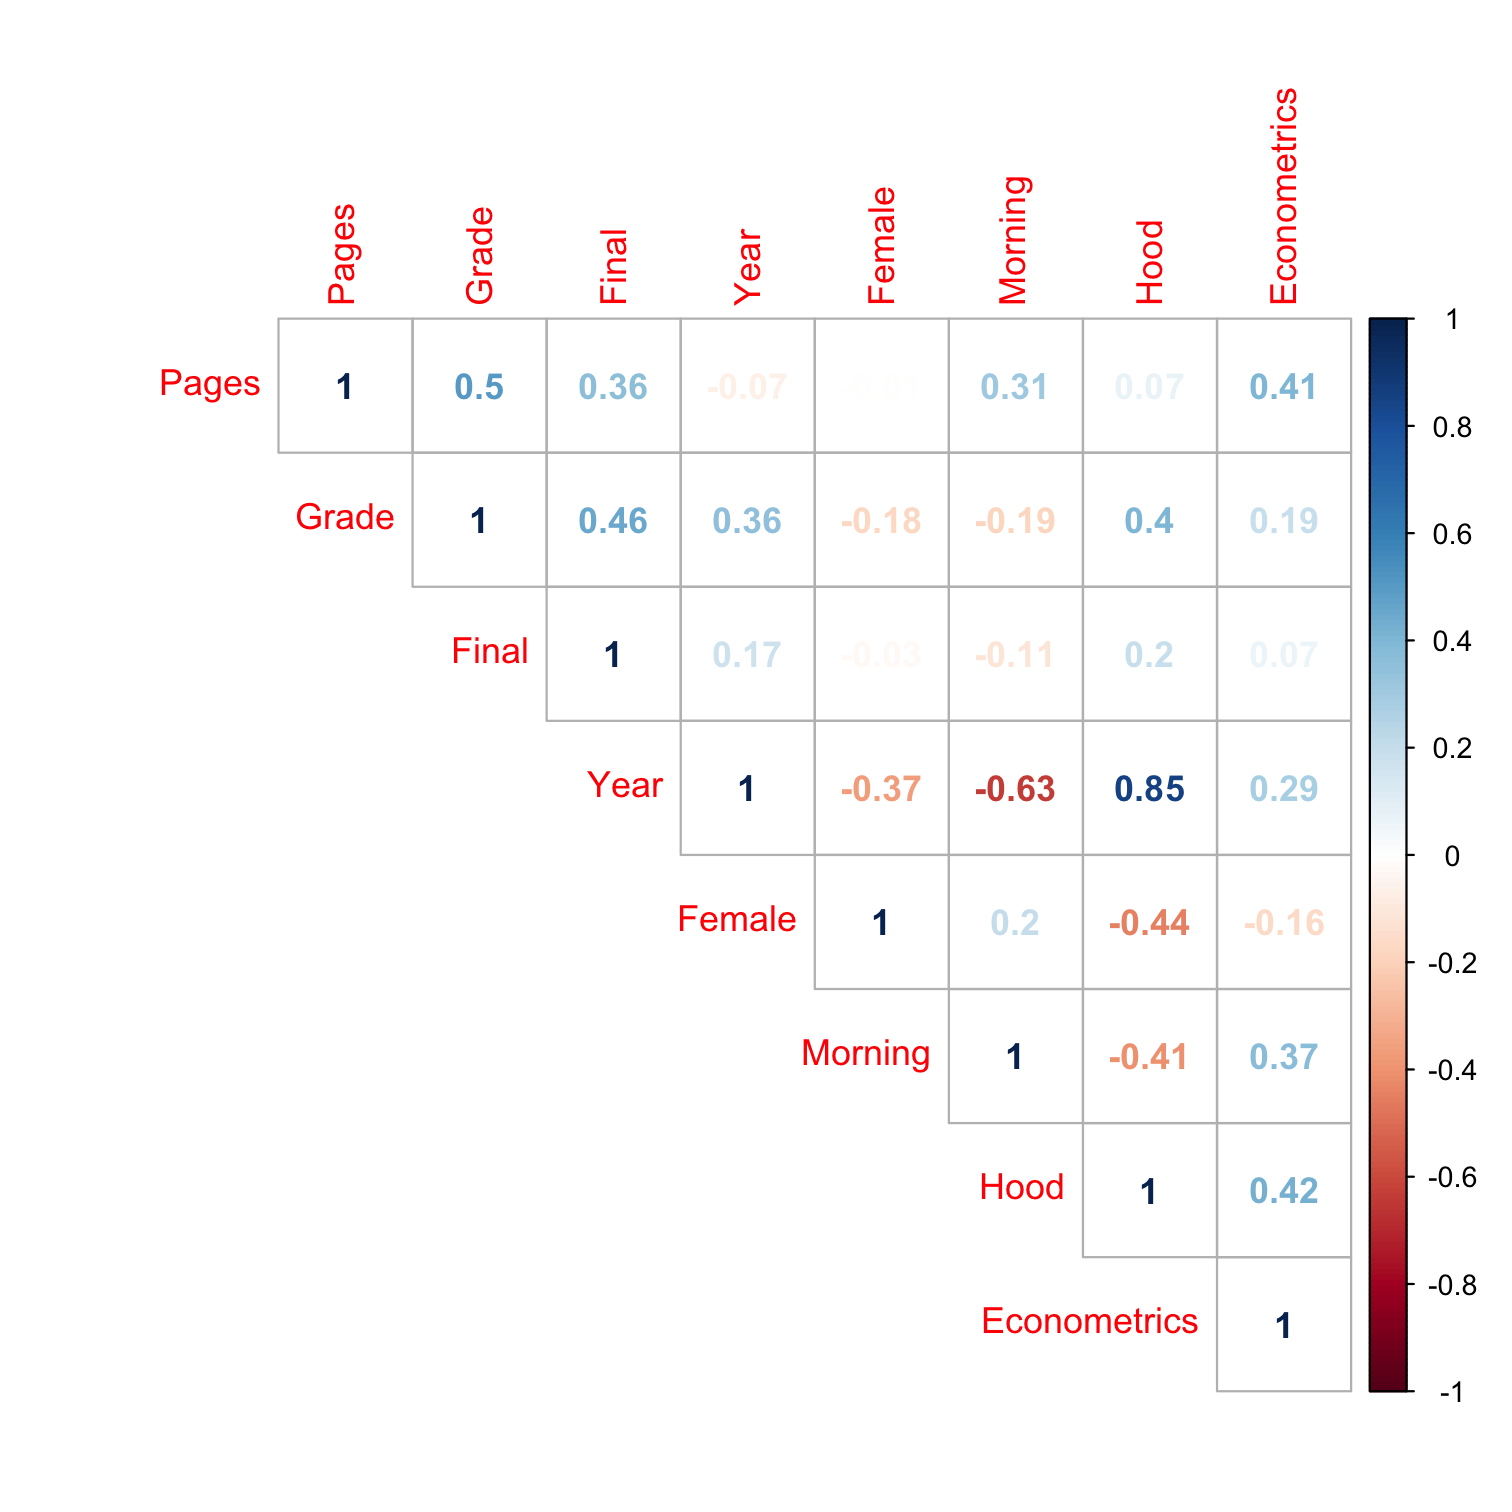
- A table of correlations of key variables
- Plots of most important variables and interactions (histograms, boxplots, scatterplots, etc)
Data: Variables
| Variable | Description |
|---|---|
| Grade | Grade on paper assignment (0-100) |
| Pages | Number of pages written |
| Final | Final grade for student in class |
| Gender | Gender of student |
| Class | Class in which paper was assigned |
| School | School of class taught |
| Year | Year of class |
| Time | Time of day class met |
- All variables were collected from assignments that I gave over the 2013-2019 period at three colleges I taught at
Data: Summary Statistics of Quantitative Variables
| Variable | Obs | Min | Q1 | Median | Q3 | Max | Mean | Std. Dev. |
|---|---|---|---|---|---|---|---|---|
| Econometrics | 162 | 0.0 | 0.00 | 0.00 | 1.00 | 1.00 | 0.28 | 0.45 |
| Female | 162 | 0.0 | 0.00 | 0.00 | 1.00 | 1.00 | 0.37 | 0.48 |
| Final | 162 | 8.5 | 82.03 | 86.54 | 92.54 | 109.09 | 85.56 | 11.69 |
| Grade | 162 | 0.0 | 83.00 | 87.00 | 91.00 | 100.00 | 84.94 | 13.57 |
| Hood | 162 | 0.0 | 0.00 | 1.00 | 1.00 | 1.00 | 0.69 | 0.47 |
| Morning | 162 | 0.0 | 0.00 | 1.00 | 1.00 | 1.00 | 0.73 | 0.44 |
| Pages | 162 | 0.0 | 7.00 | 9.00 | 11.75 | 24.00 | 9.51 | 3.98 |
| Year | 162 | 2014.0 | 2014.00 | 2016.00 | 2017.00 | 2019.00 | 2016.16 | 1.73 |
Data: Counts of Categorical Variables I
| Year | n |
|---|---|
| 2014 | 51 |
| 2016 | 38 |
| 2017 | 39 |
| 2018 | 13 |
| 2019 | 21 |
| Sex | n |
|---|---|
| Female | 60 |
| Male | 102 |
| Time | n |
|---|---|
| Afternoon | 43 |
| Morning | 119 |
| Class | n |
|---|---|
| Econometrics | 45 |
| Game Theory | 21 |
| IEP | 51 |
| IO | 22 |
| Trade | 23 |
| School | n |
|---|---|
| GMU | 51 |
| Hood | 111 |
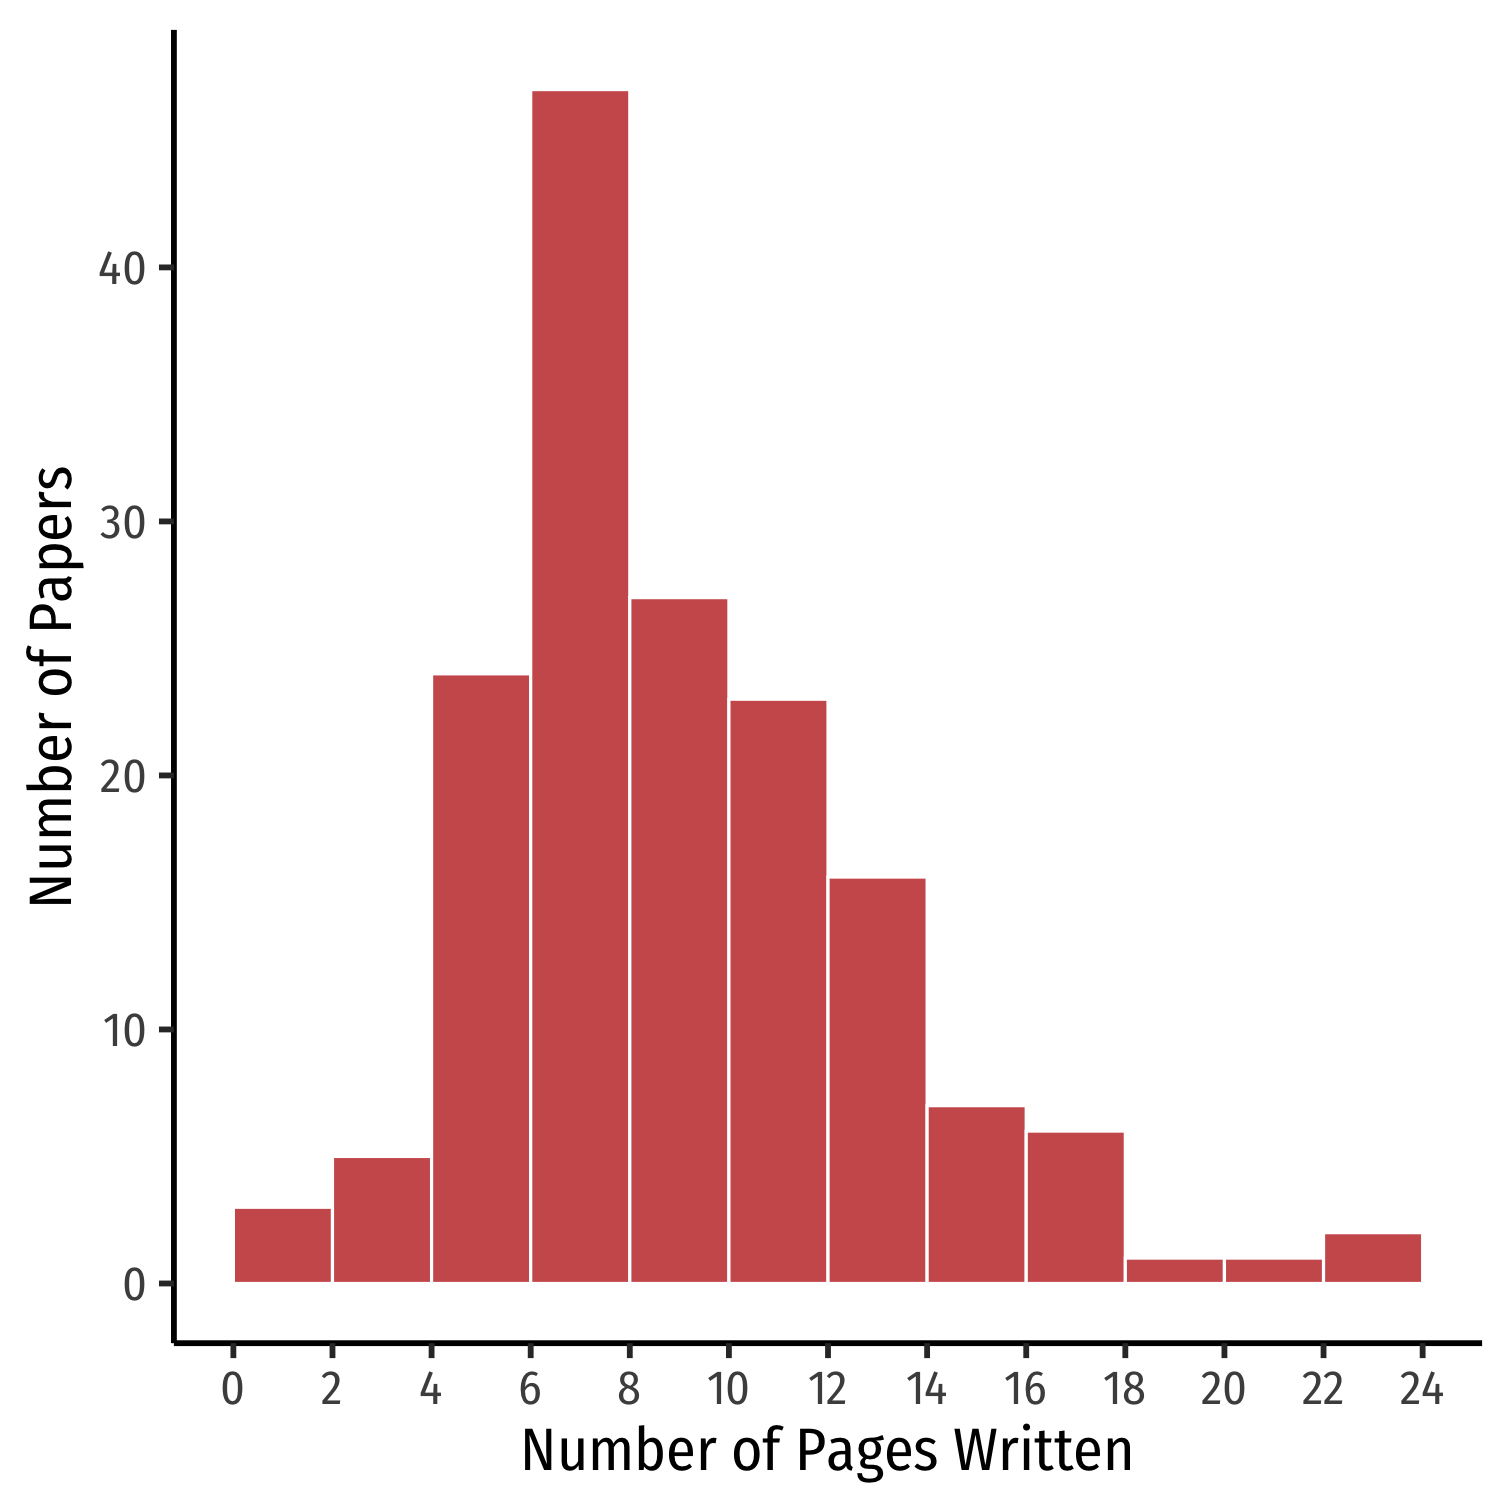
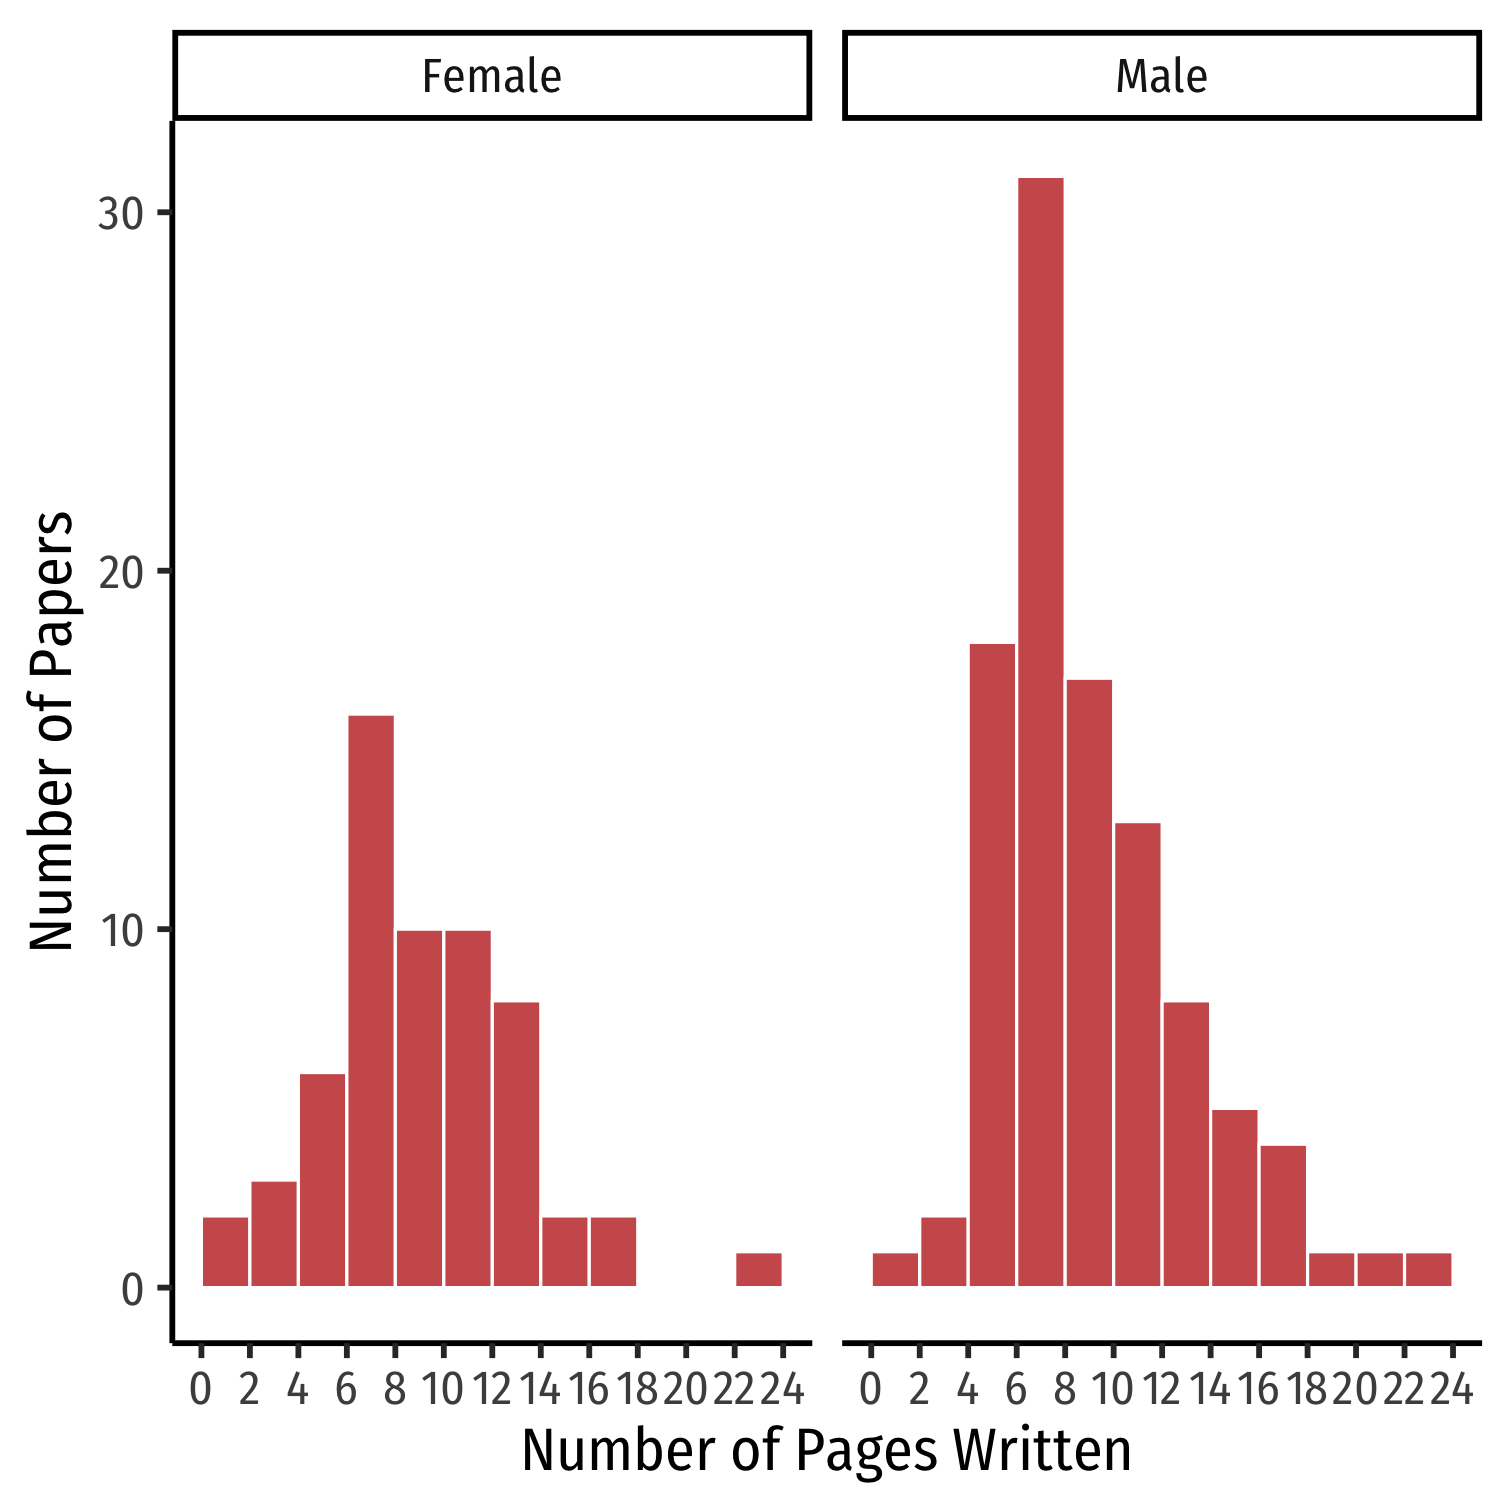
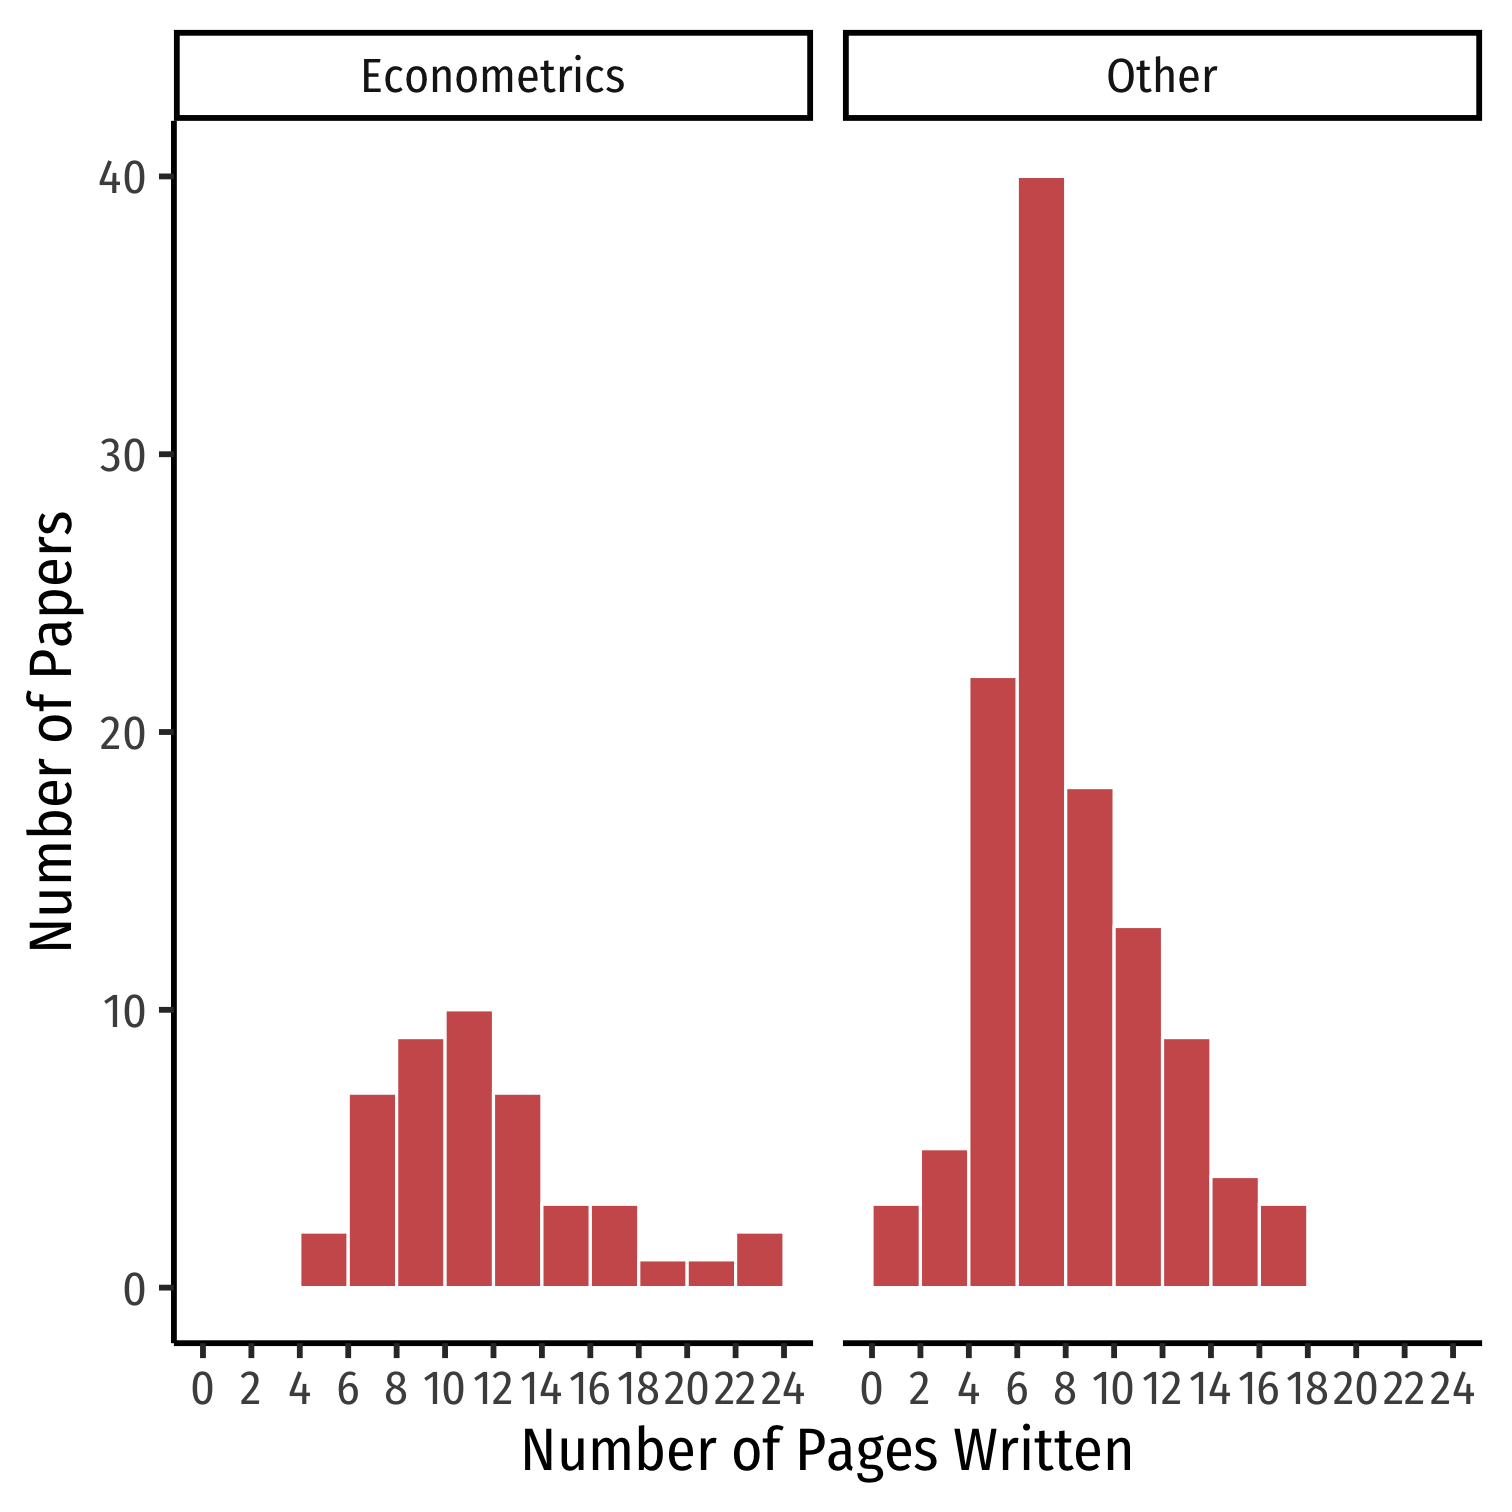
Data: Histogram I
Data: Histogram II
Data: Scatterplot I
Data: Scatterplot II
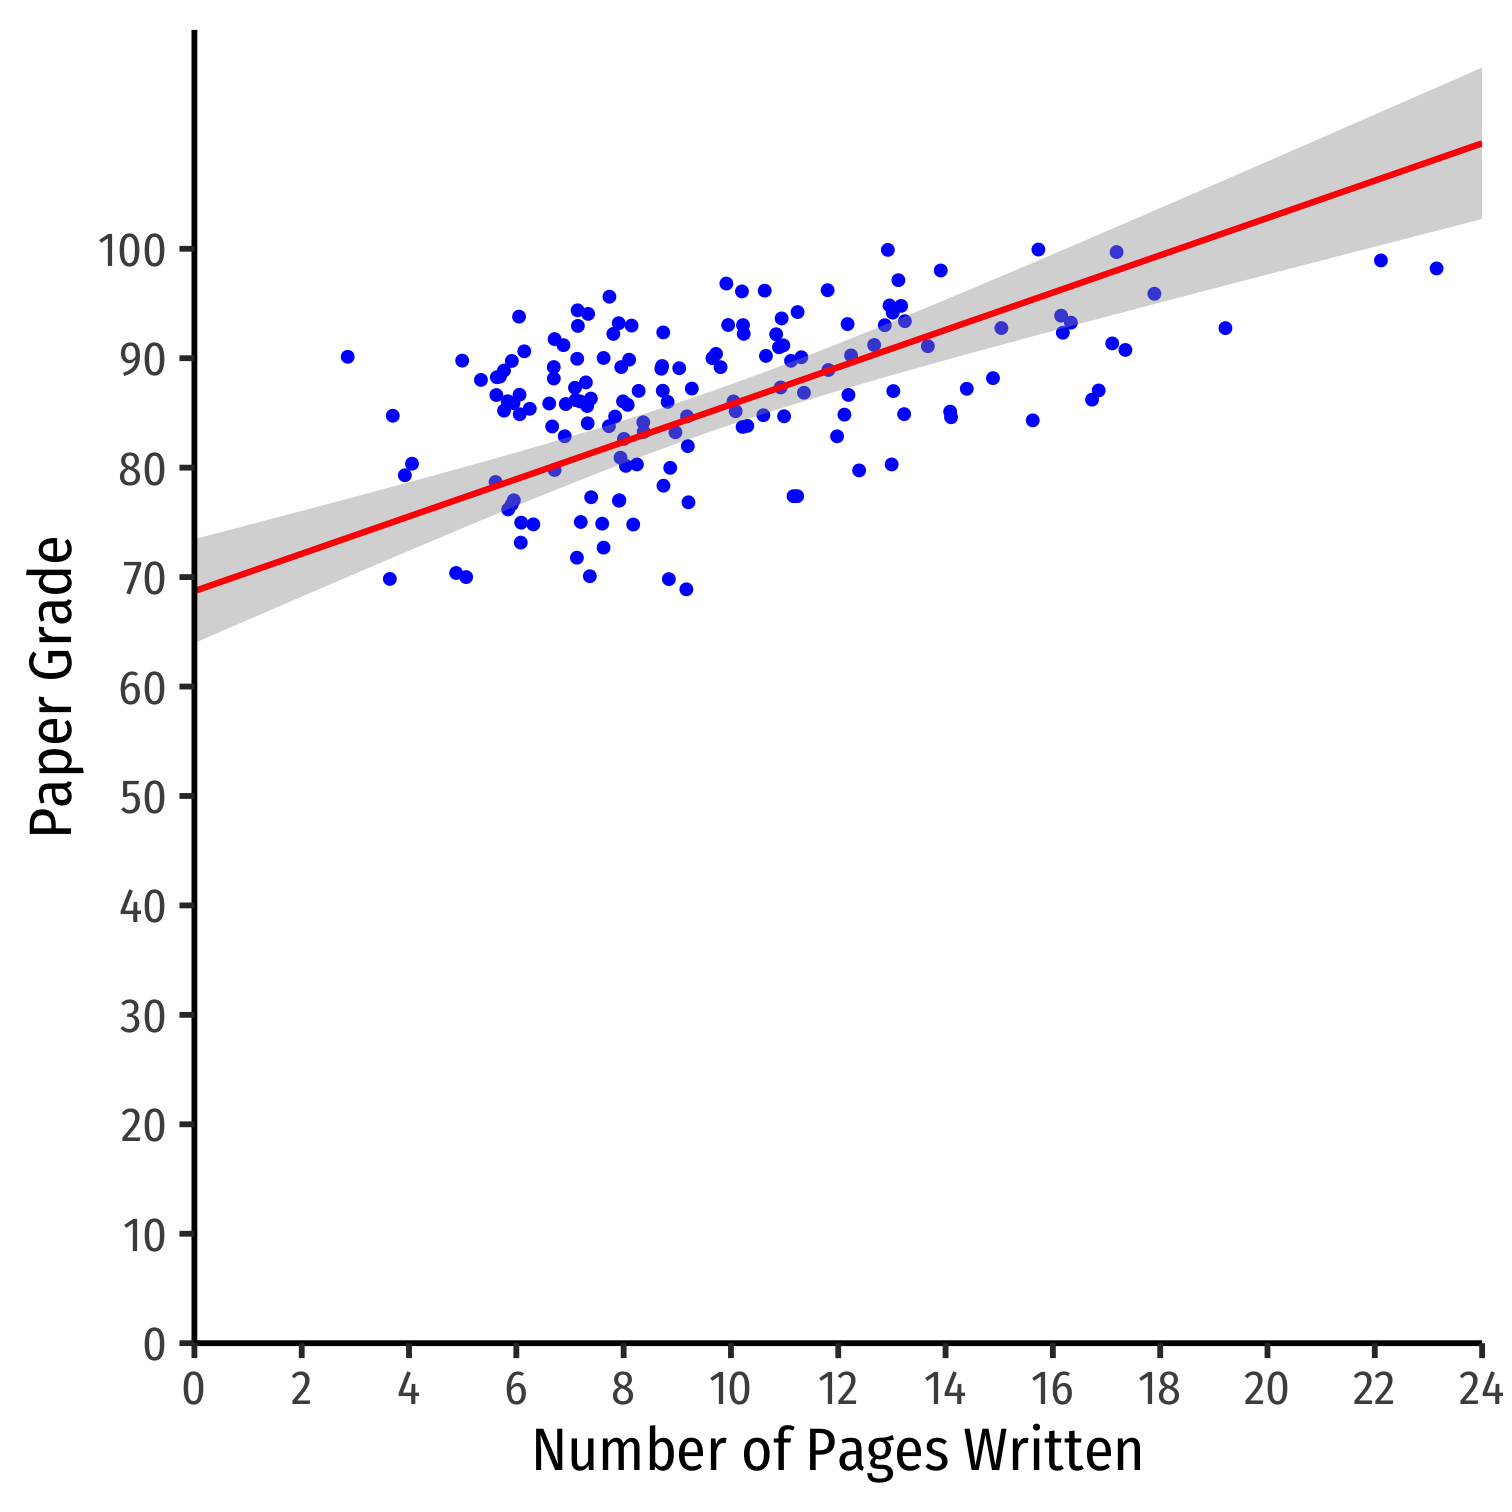
Data: Scatterplot III
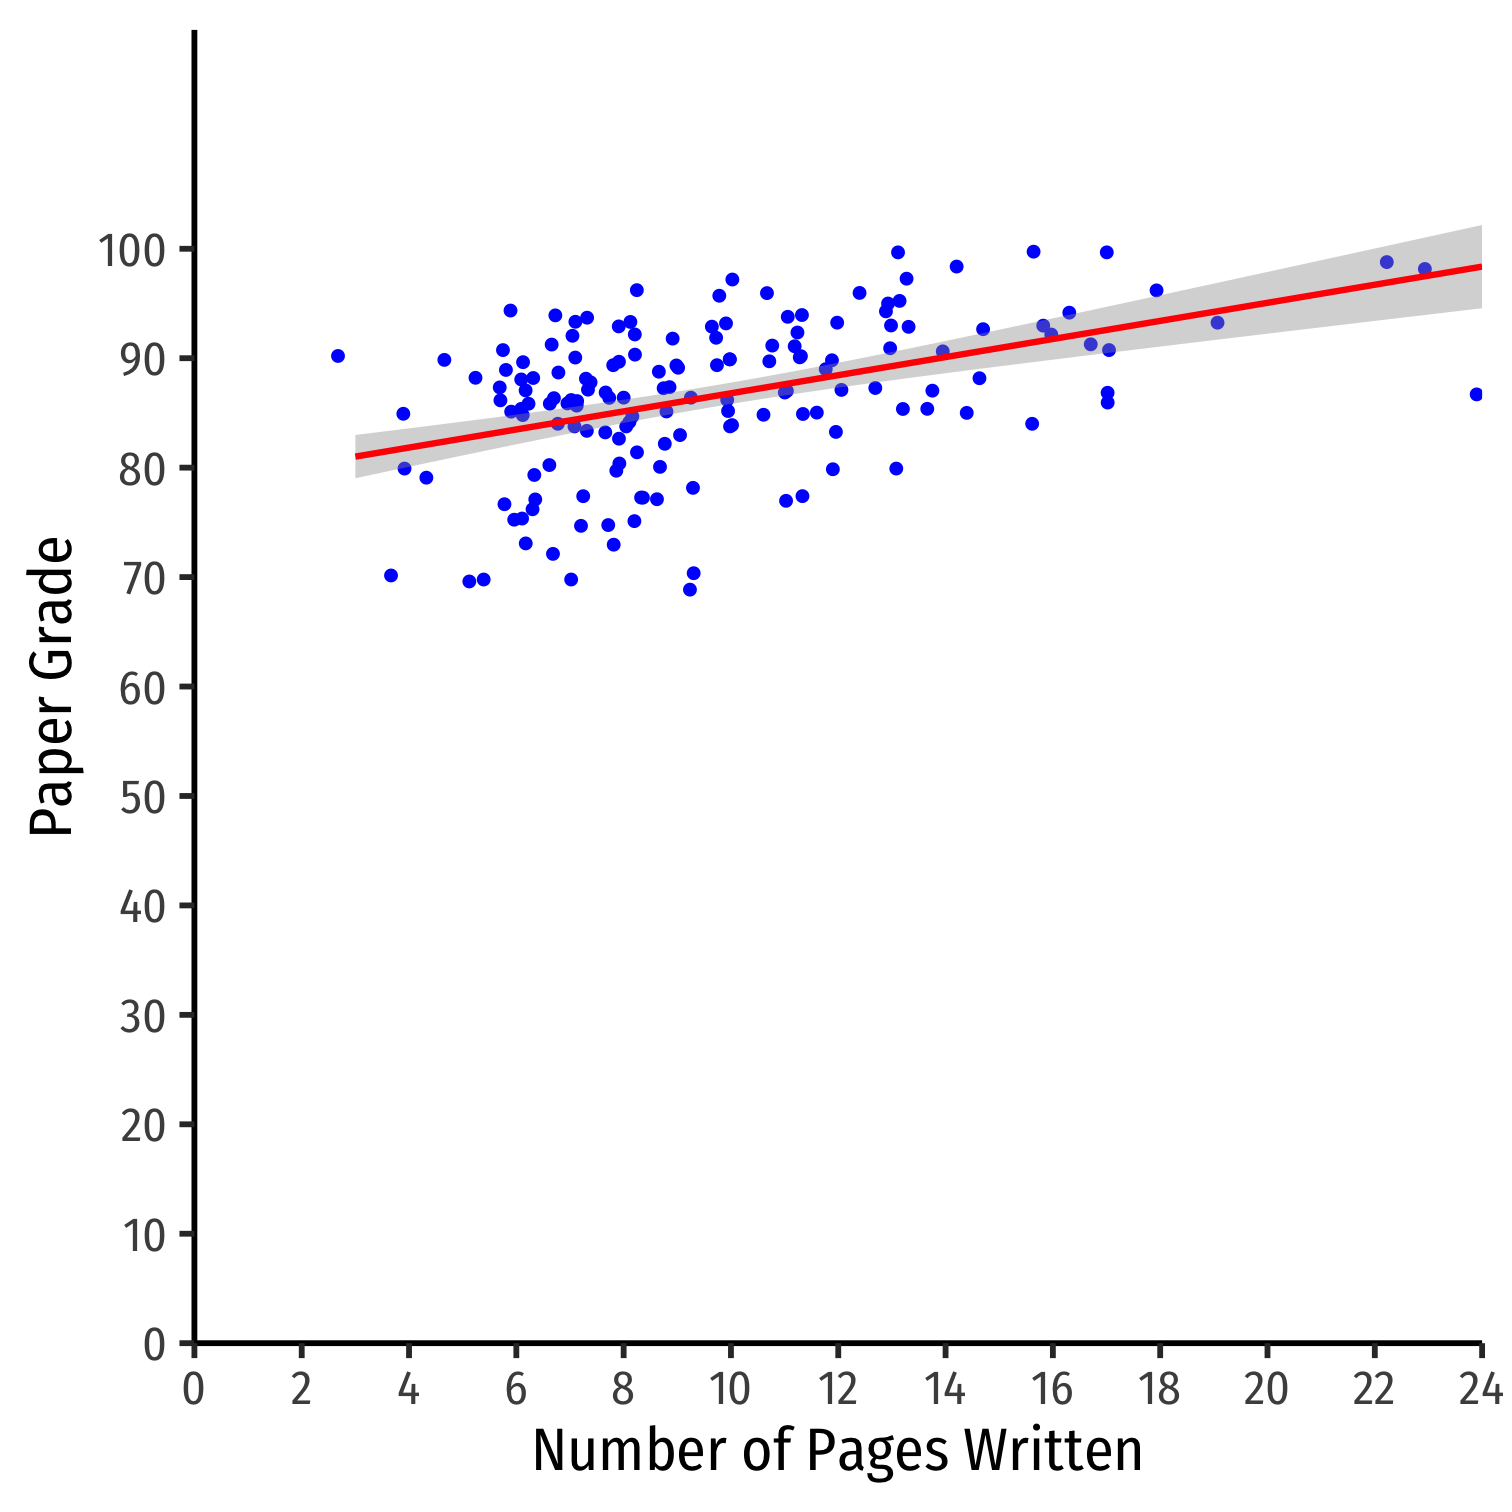
Data: Scatterplot IV
Data: Scatterplot V
Empirical Model I
Describe your empirical model and your identification strategy
- for most of you, just OLS and trying to include as many controls to remove omitted variable bias
Why did you pick certain variables?
How do you battle endogeneity?
Hypothesize your expected size and magnitude of key variables
- Give some economic intution behind what we would expect!
Empirical Model II
Example: Gradei=Lengthi+Finali+Femalei+Morningi+Hoodi+Metricsi+ui
Length is the most important variable we care about
Length probably endogenous, correlated with other Grade-determining factors:
- Why we included Final, Female, Morning, Hood, and Metrics
We probably expect Length to be positive and small
Empirical Model III
- Describe the limitations of your model
- Every paper, even Nobel prize-winning ones, have limitations and problems!
- Limited and/or poor quality data
- Endogeneity, simultaneous causation, omitted variable bias
Example: The model likely suffers from endogeneity, as how many pages a student writes is likely to be positively correlated with personal attributes like dilligence, conscientiousness, and intelligence, which themselves are likely positively correlated with the grade of the paper. Thus, we have likely \emph{over}stated the effect of page length on paper grades.Furthermore, we are unable to measure other variables that make page length endogenous, such as the topic that was chosen. Some topics lend themselves to shorter or longer papers and may have better or worse data that make it easier or difficult to run a clean empirical test.
Empirical Model IV
Are your results robust across different model specifications?
- Do the size(s) of the marginal effect(s) you care about change or reverse direction? Become/lose significance?
At minimum, you must run several models, including a multivariate regression
- Run several variations of your model with and without controls (e.g. just Y and X, Y and X1 and X2, etc.)
- Check for nonlinearities: polynomials, logs, etc.
Results I
Print a table(s) of your regression(s) results (
huxtableis ideal)Interpret your data
- What does a marginal (1 unit) change in X mean for Y, a 1% change, etc?
- Is each coefficient statistically significant (at 10, 5, or 1% levels)?
| Baseline | No Os | Econometrics Only | With Final Grades | Controls | Hood Only | Econometrics Only | |
| Constant | 68.72 *** | 78.53 *** | 77.66 *** | 53.80 *** | 60.74 *** | 47.67 *** | 41.54 *** |
| (2.41) | (1.35) | (2.48) | (3.83) | (3.67) | (4.11) | (5.24) | |
| Length | 1.70 *** | 0.83 *** | 0.95 *** | 0.53 *** | 0.80 *** | 0.41 *** | 0.38 * |
| (0.23) | (0.13) | (0.19) | (0.12) | (0.12) | (0.11) | (0.15) | |
| Course Grade | 0.32 *** | 0.26 *** | 0.44 *** | 0.50 *** | |||
| (0.05) | (0.04) | (0.05) | (0.07) | ||||
| Female | -2.25 ** | -0.06 | -1.17 | ||||
| (0.83) | (0.87) | (1.31) | |||||
| Morning | -4.89 *** | -1.91 * | |||||
| (1.00) | (0.86) | ||||||
| N | 162 | 159 | 45 | 159 | 159 | 111 | 45 |
| R-Squared | 0.25 | 0.20 | 0.36 | 0.39 | 0.51 | 0.59 | 0.72 |
| SER | 11.79 | 6.21 | 5.56 | 5.47 | 4.93 | 3.77 | 3.75 |
| *** p < 0.001; ** p < 0.01; * p < 0.05. | |||||||
Results: Interpretation!
Are your estimates economically significant?
How big is "big"?
No economist has achieved scientific success as a result of a statistically significant coefficient. Massed observations, clever common sense, elegant theorems, new policies, sagacious economic reasoning, historical perspective, relevant accounting, these have all led to scientific success. Statistical significance has not.'' McCloskey & Ziliak (1996: 112)
Results: Interpretation!

Results: Interpretation!
Example: I find that for every additional page written, we can expect a paper's grade to increase by about a point or less, after controlling for other factorssuch as Final grade (proxying as a measure of overall diligence and intelligence), sex, and time of day. In the most relevant sample, econometrics students, the effect is even smaller, only about a third of a point increase for every additional page written. This small effect is statistically significant at the 10% level only.
However, we should not make much of these results due to the likely endogeneity of Pages due to unobserved factors such as topic and quality of writing, which clearly would matter much both for length and for grade. It would be poor advice to recommend students simply to write long papers to earn a higher grade.
Results: Implications
- Describe several implications of your paper
- Policy implications
- Proposals for new research
- Effects on current understanding
- What else should we try to found out to answer the question better?
Don't Get Discouraged

Don't Get Discouraged

Don't Get Discouraged

Albert Enstein
(1870-1924)
"If we knew what it was we were looking for, we wouldn't call it research, would we?"
Deadlines and Reminders (From the Assignment Page)
| Assignment | Points | Due Date | Description |
|---|---|---|---|
| Abstract | 5 | October 29 | Short summary of your ideas |
| Data Description | 10 | November 14 | Description of data sources, and some summary statistics |
| Literature Review | 10 | December 5 | 1-3 paragraphs on 2-3 scholarly sources |
| Presentation | 5 | December 10/12 | Short presentation of your project so far |
| Final Paper Due | 70 | December 17 | Email to me paper, data, code |
- note for each stage (except the Final Paper), it's more than okay that your final topics, data, etc will change!
- for each assignment, I will take 1 point off for every 24 hours it is late
Grading of Final Paper (From the Assignment Page)
| Category | Points |
|---|---|
| Persuasiveness | 10 |
| Clarity | 10 |
| Econometric Validity | 20 |
| Economic Soundness | 20 |
| Organization | 5 |
| References | 5 |
| TOTAL | 70 |
Submitting your Final Paper
When you send your final email (by Thursday December 20), it should contain the following files:
Your final paper as a
.pdf. It should include an abstract and bibliography and all tables and figures.The (commented!) code used for your data analysis (i.e. loading data, making tables, making plots, running regressions)
- either
.Rfiles OR a.Rmdfile. I want to know how you reached the results you got! Reproducibility is the goal!
- either
Your data used, in whatever original format you found it (e.g.
.csv,.xlsx,.dta)