3.5: Causal Inference and DAGs - R Practice
Set Up
To minimize confusion, I suggest creating a new R Project (e.g. regression_practice) and storing any data in that folder on your computer.
Alternatively, I have made a project in R Studio Cloud that you can use (and not worry about trading room computer limitations), with the data already inside (you will still need to assign it to an object).
Part A DAG Practice
For each of the following DAGs:You can use dagitty.net to help you, but you should start trying to recognize these on your own!
- Write out all of the causal pathways from
X(treatment of interest) toY(outcome of interest).
- Write out all of the causal pathways from
- Identify which variable(s) need to be controlled for to estimate the causal effect of
XonY.
- Identify which variable(s) need to be controlled for to estimate the causal effect of
- Write out the regression equation (abstractly) for properly identifying the causal effect, based on part ii.
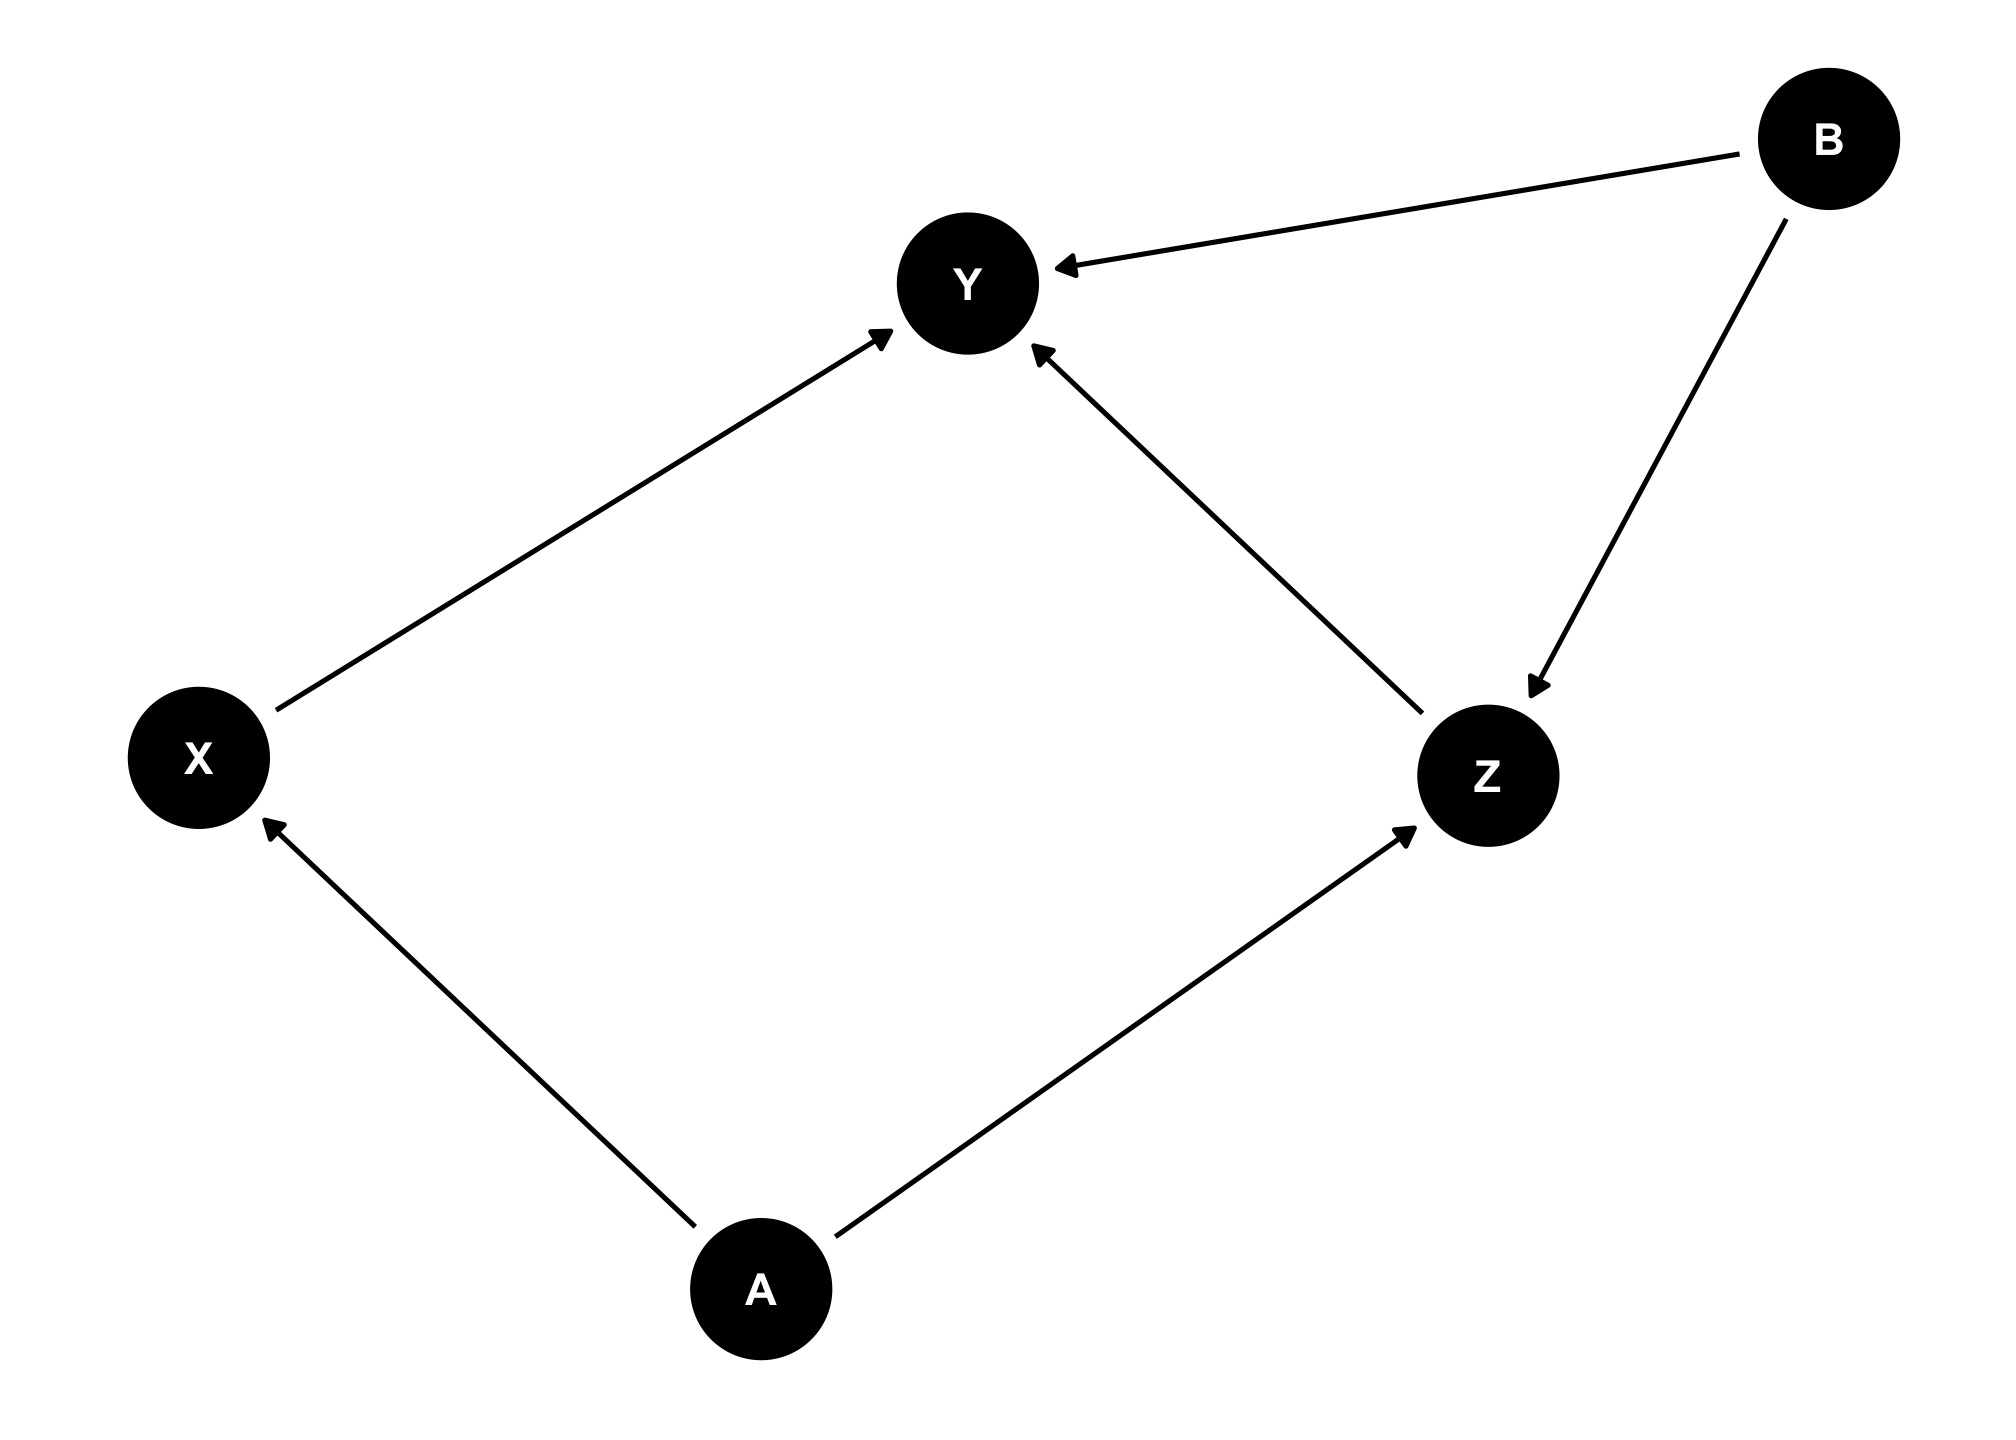
Example A

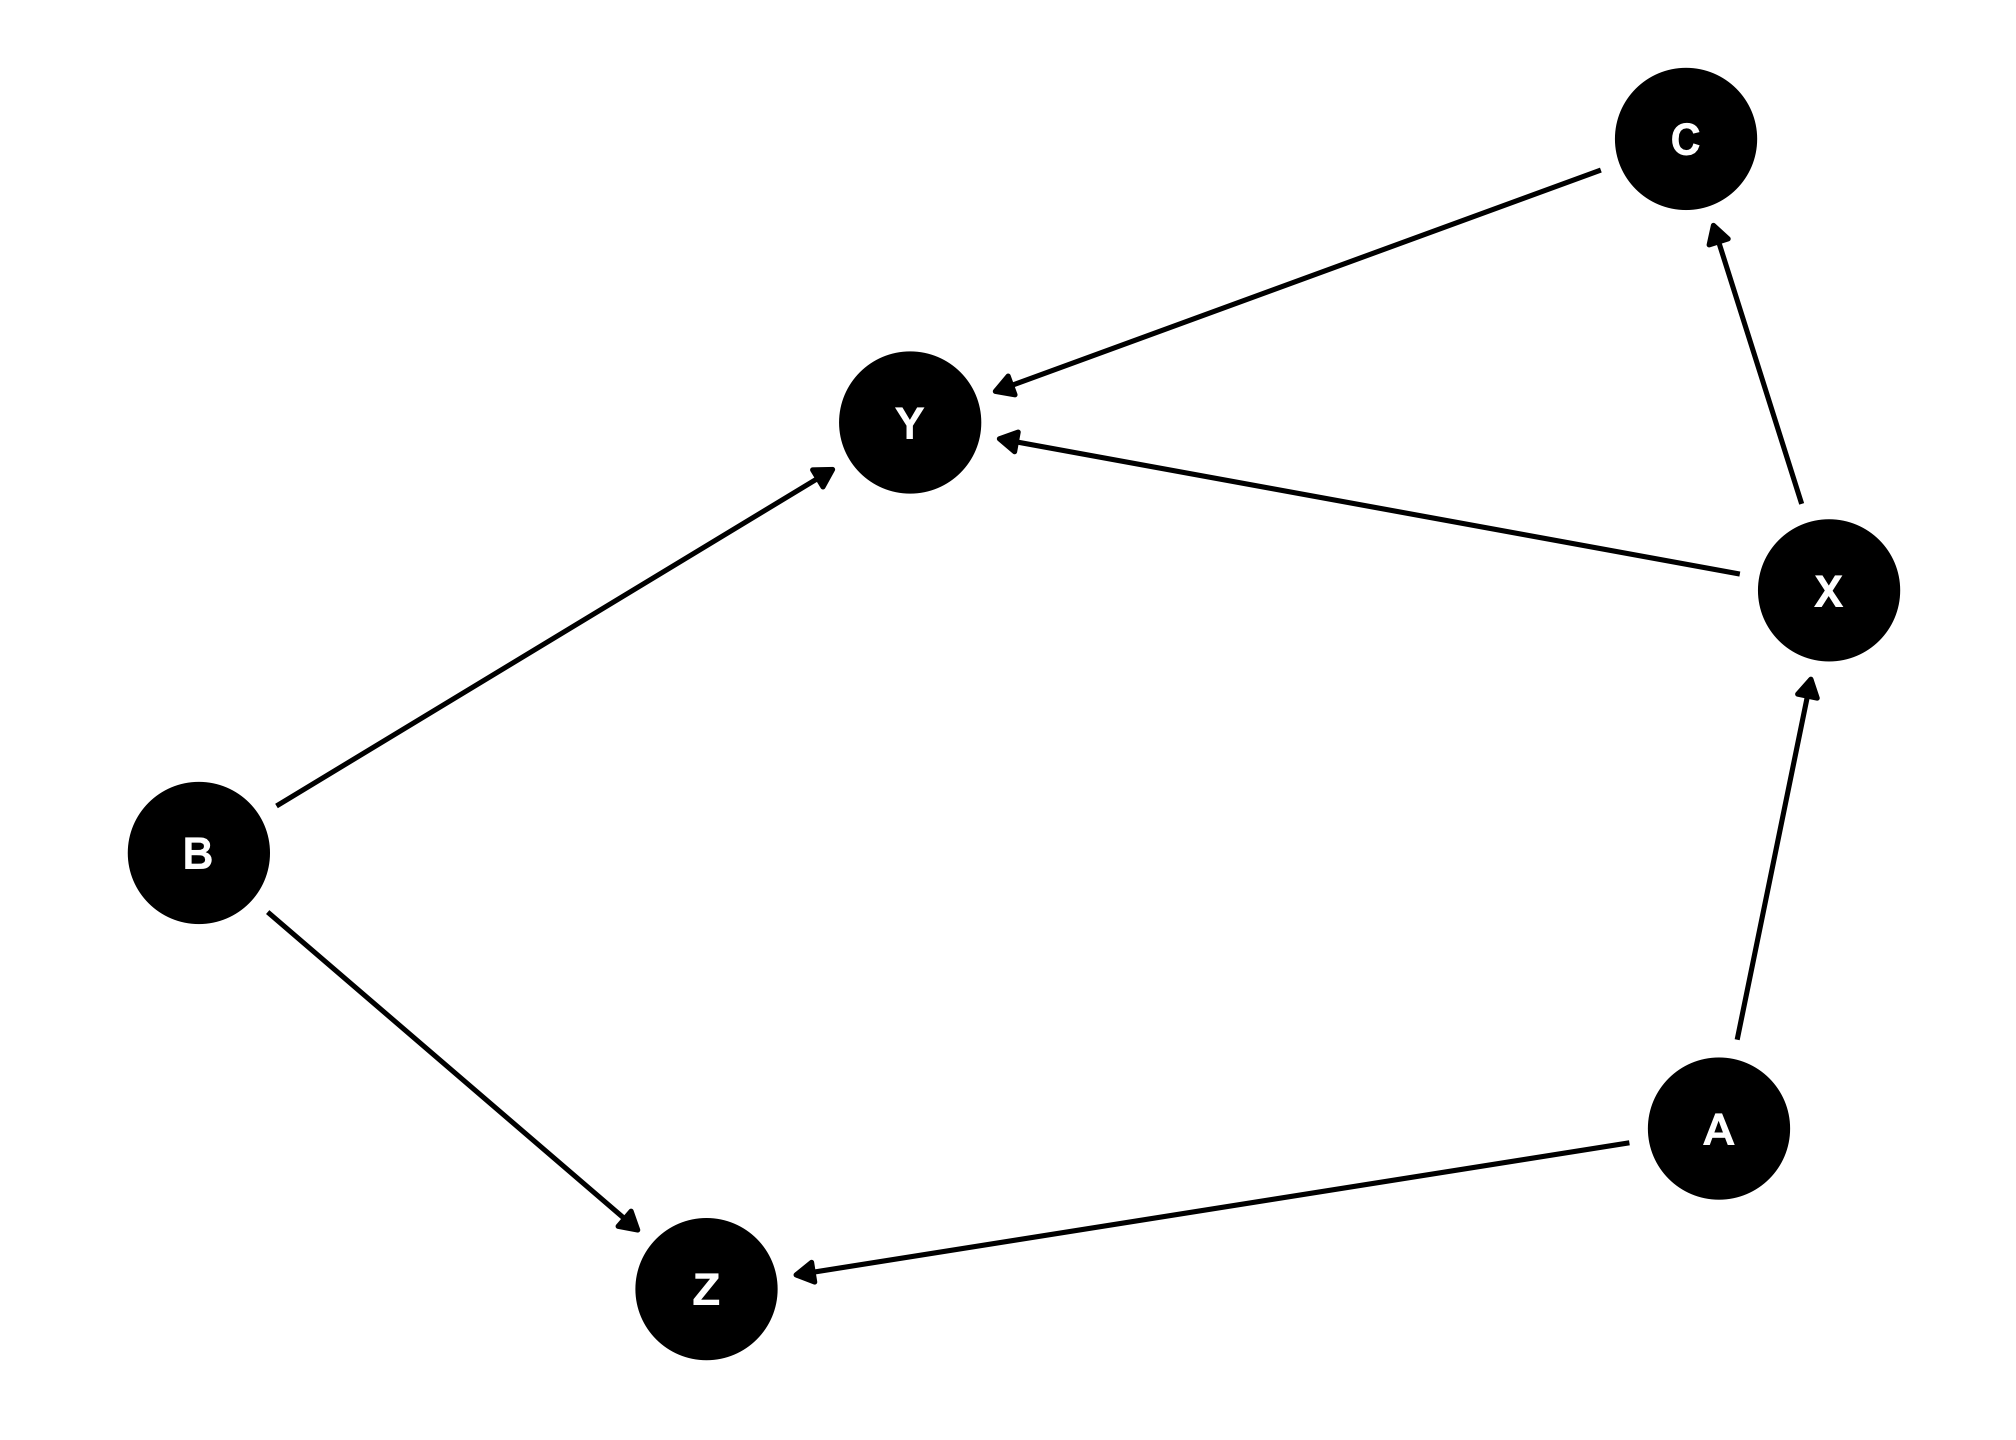
Example B

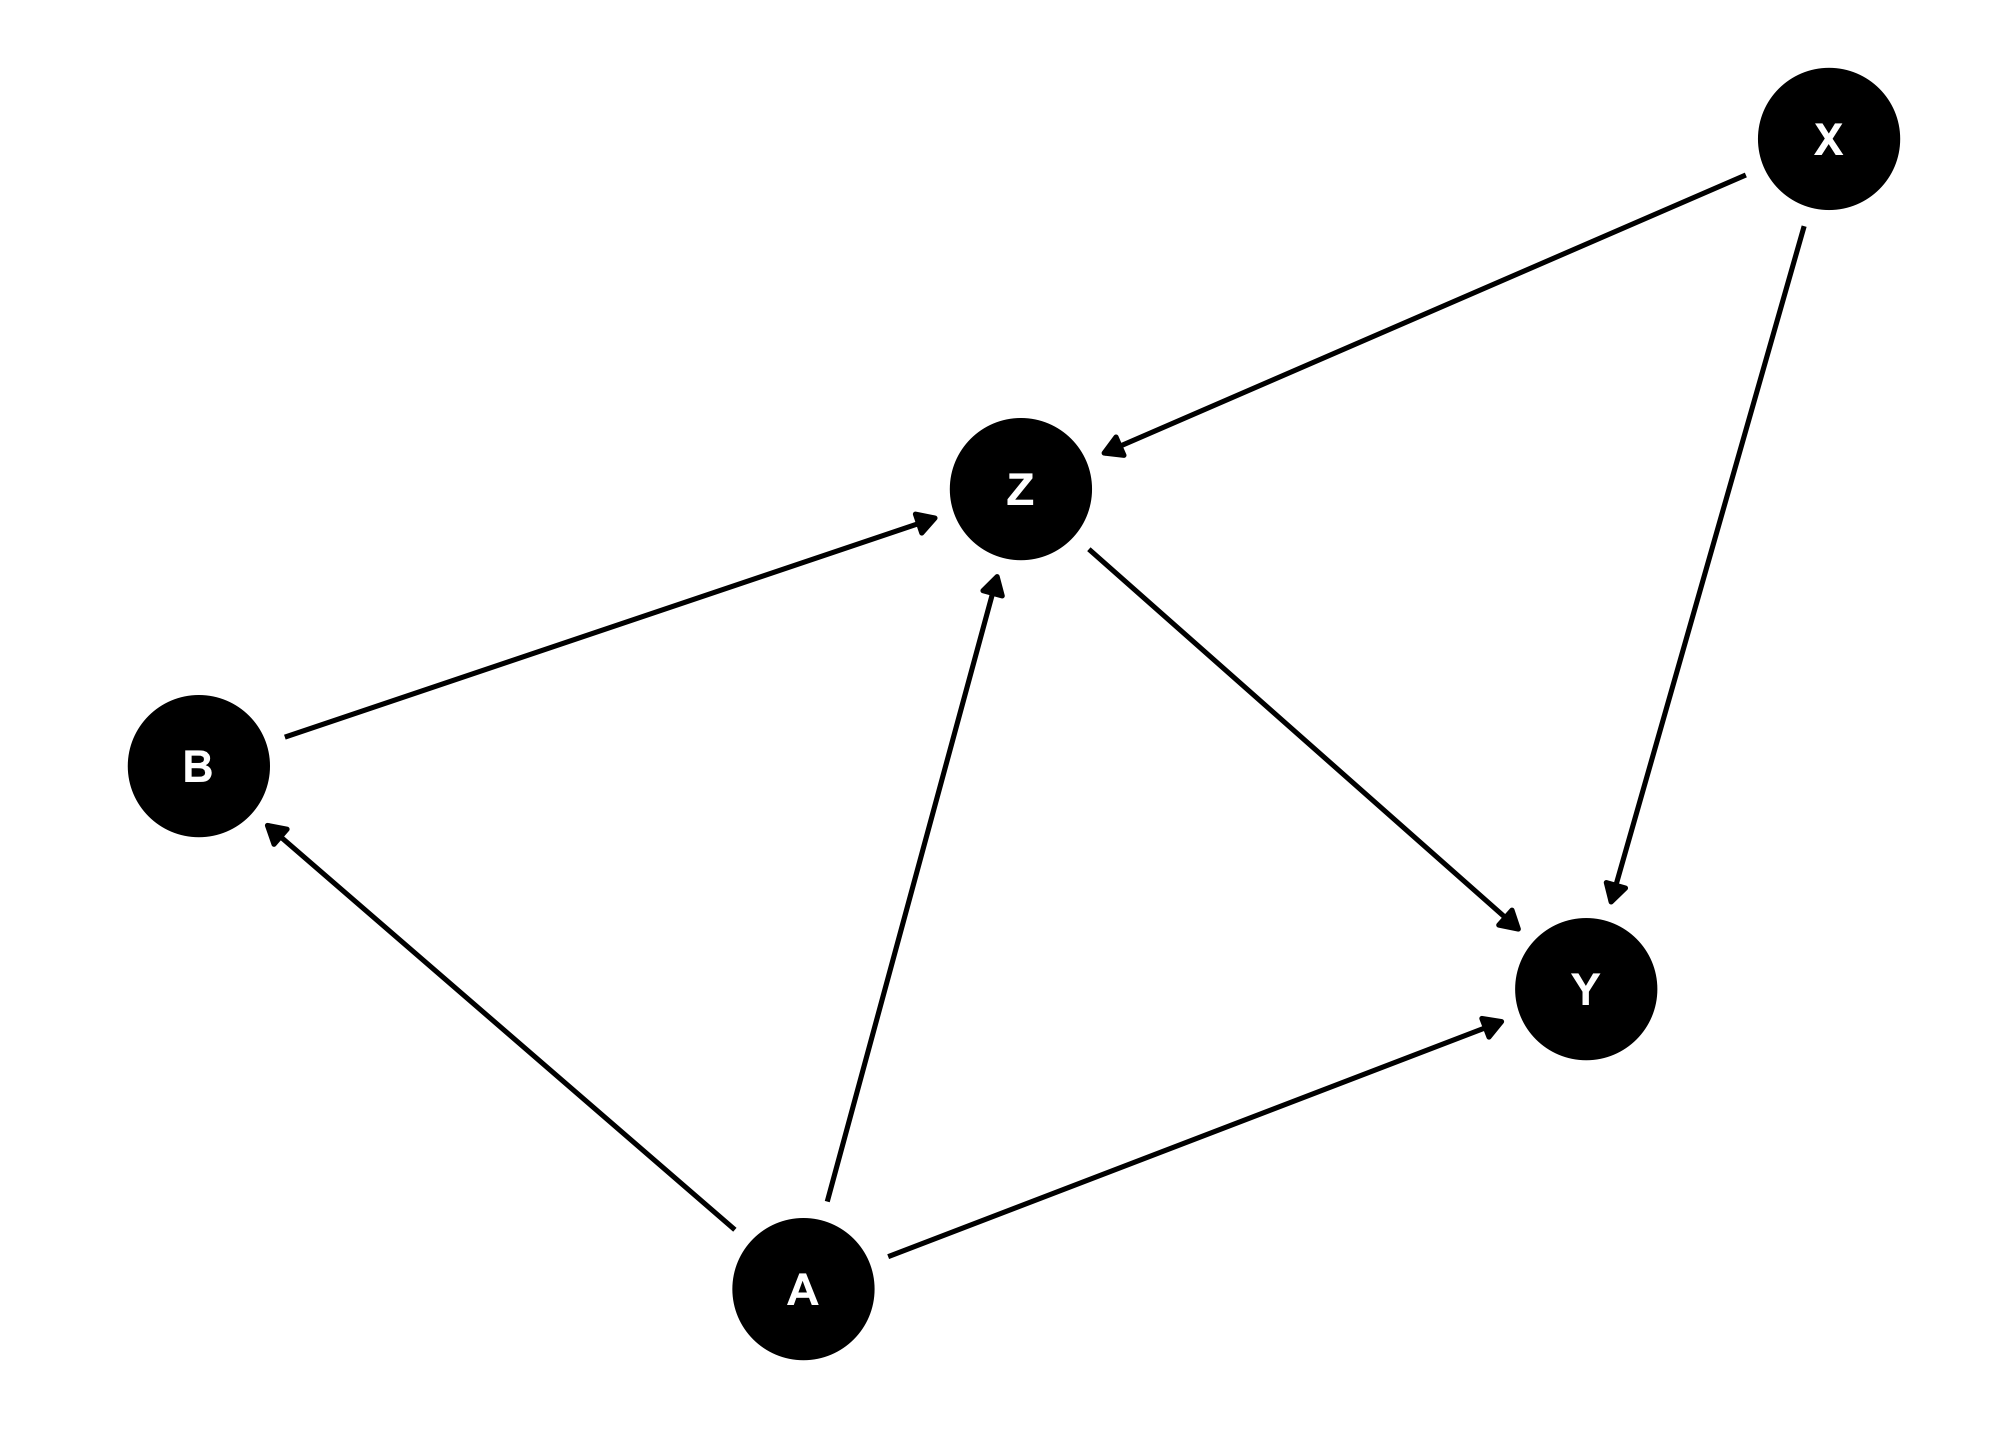
Example C
Example D
Example E
Part B Empirical Example
Question 1
Install the wooldridge package if you do not already have it installed.This package contains datasets used in Jeffrey Wooldrige’s Introductory Econometrics: A Modern Approach (the textbook that I used in my econometrics classes years ago!)
We will use the bwght data from wooldridgeWhich comes from The 1988 National Health Interview Survey., used in J. Mullahy (1997), “Instrumental-Variable Estimation of Count Data Models: Applications to Models of Cigarette Smoking Behavior,” Review of Economics and Statistics 79: 596-593.
Let’s just look at the following variables:
| Variable | Description |
|---|---|
bwght |
Birth Weight (ounces) |
cigs |
Cigarettes smoked per day while pregnant (1988) |
motheduc |
Mother’s education (number of years) |
cigprice |
Price of cigarette pack (1988) |
faminc |
Family’s income in $1,000s (1988) |
We want to explore how a mother smoking during pregnancy affects the baby’s birthweight (which may have strong effects on outcomes over the child’s life).
Just to be explicit about it, assign this as some dataframe (feel free to change the name), i.e.:
Question 2
Make a correlation table for our variables listed above.Hints: select() these variables and then pipe them into cor(., use="pairwise.complete.obs") to use only observations for which there are data on each variable (to avoid NA’s).
Question 3
Consider the following causal model:
library(ggdag)
dagify(bwght~cigs+inc,
       cigs~price+educ+inc,
       inc~educ,
       exposure = "cigs",
       outcome = "bwght") %>%
  ggdag(stylized = FALSE, seed=1)+theme_dag_blank()+theme(legend.position = "none")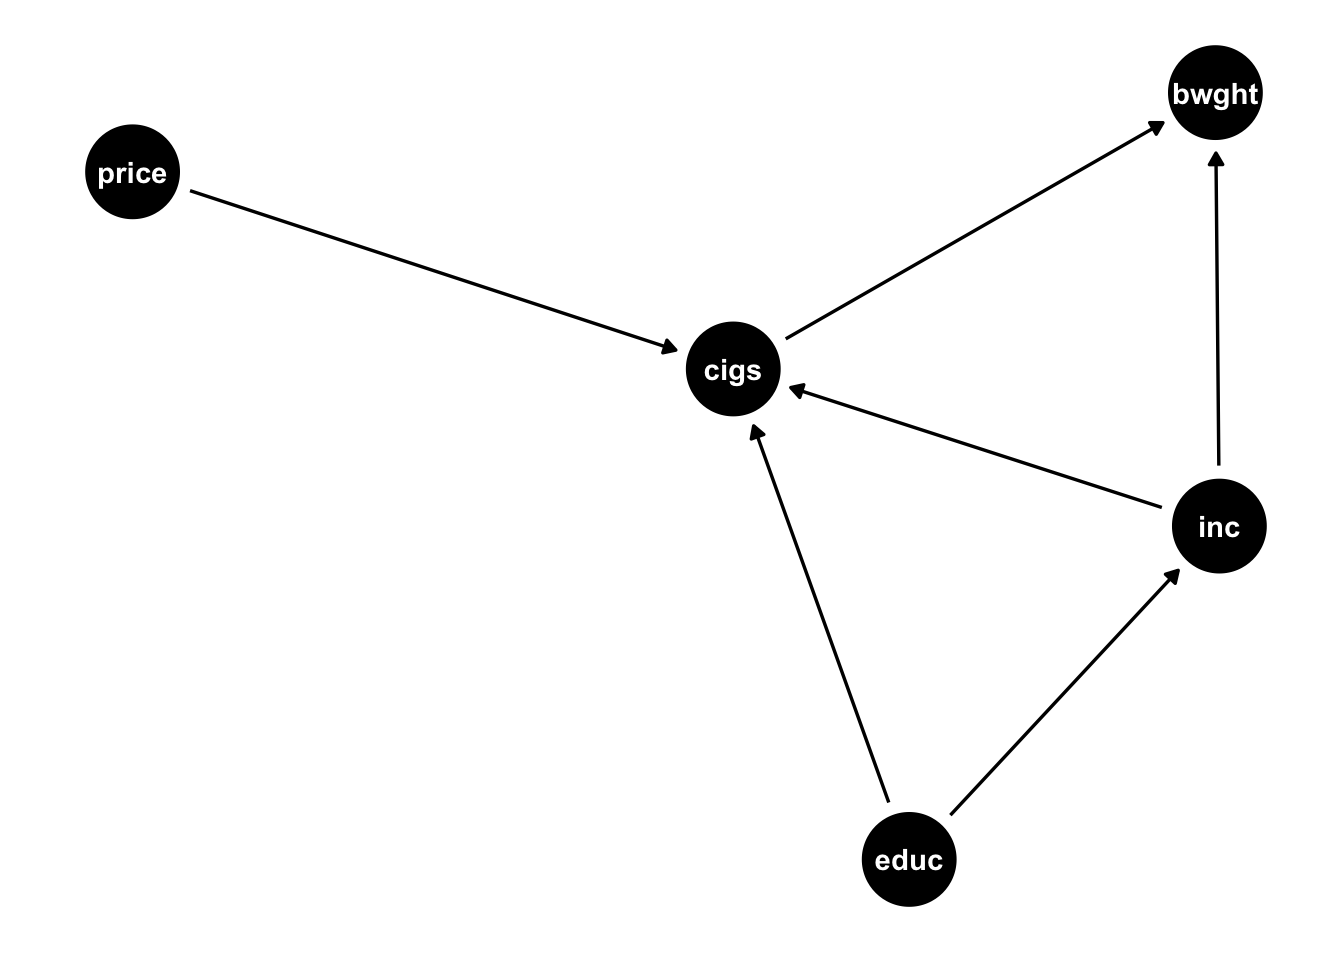
Note what we are hypothesizing:
bwghtis caused bycigsandinccigsare caused byprice,educ, andincincis caused byeduc
See also how this is written into the notation in R to make the DAG.
Create this model on dagitty.net.
Question 4
What does dagitty tell us the testable implications of this causal model?
Question 5
Test each implication given to you by dagitty.
- For independencies (x⊥y): run a regression of y on x.
- For conditional independencies (x⊥y|z,a): run a regression of y on x,z,a.
For each, test against the null hypothesis that the relevant coefficient (^β1) is 0 (i.e. x and y are indeed independent).
Does this causal model hold up well?
Question 6
List all of the possible pathways from cigs to bwght. Which are “front-doors” and which are “back-doors?” Are any blocked by colliders?
Question 7
What is the minimal sufficient set of variables we need to control in order to causally identify the effect of cigs on bwght?
Question 8
Estimate the causal effect by running the appropriate regression.Note, on dagitty, you can change a variable on the diagram to be “adjusted” (controlled for) by double-clicking it and then hitting the A key.
Question 9
We saw some effect between faminc and cigprice. Perhaps there are unobserved factors (such as the economy’s performance) that affect both. Add an unobserved factor u1 to your dagitty model.Note, on dagitty, you can make a variable be “unobserved” by double-clicking it and then hitting the U key.
Question 10
Perhaps our model is poorly specified. Maybe motheduc actually has a causal effect on bwght? Tweak your model from Question 9 on dagitty to add this potential relationship. What testable implications does this new model imply?
Question 11
Test these implications appropriately, like you did in Question 5. Does this model hold up well?
Question 12
Under this new causal model, list all of the possible pathways from cigs to bwght. Which are “front-doors” and which are “back-doors?” Are any blocked by colliders?
Question 13
Under this new causal model, what is the minimal sufficient set of variables we need to control in order to causally identify the effect of cigs on bwght?
Question 14
Estimate the causal effect in this new model by running the appropriate regression. Compare your answers to those in question 8.
Question 15
Try out drawing this model using the ggdag package in R. See my DAG in question 3 for an example.